Mild Valuation Headwinds for US Equities
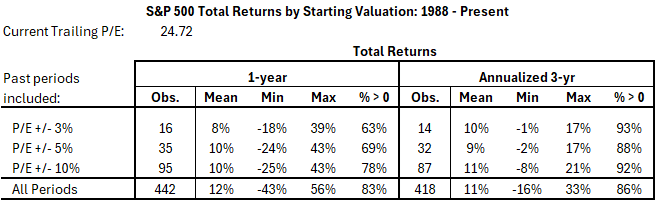
The trailing P/E for the S&P 500 Total Return Index has fallen to 24.7, notably lower than last month yet still higher than 84% of periods since 1984. Similar valuation levels have historically translated into mild headwinds for US stock returns.

Historical periods with starting valuations closest to today include select months during 1998, 2001-2003, 2017-18, and 2020-21. Analysis of total returns from these “best-match” periods shows the following:
- The index rose an average of 8% over the subsequent year and an annualized average of 10% over the next three years. This is only slightly lower than the index’s average total return for all periods since 1988 (12% and 11% per year, respectively).
- The index rose over the next three years in over 90% of best-match periods. However, none of the best-match periods produced the exceptional returns (30%/yr or more) that the index has achieved with lower starting valuations. The highest 3-yr return was a constrained 17% per year (Feb 2003 – Feb 2005).
- On the low side, one close comparable period (April 2001) saw annualized 3-yr returns of -1%.
Note: These results depend on how closely we match today’s trailing P/E to past values. The following table shows analysis for periods with starting P/E within 3%, 5%, and 10% of today. The story appears consistent at all levels.
Disclaimer:
This report is 100% historical fact and does not constitute investment advice. None of the information should be interpreted as a recommendation to buy, hold, or sell any investment security.
As the saying goes, past performance is not a determinant of future returns. The next 1-3 years may or may not fall within historical ranges. Differences in index asset composition, monetary policy, inflation, and numerous other factors will all play a role in corporate results that drive index dividend returns and investor decisions that drive price returns.
