Continued Valuation Headwinds for US Equities
Our trailing P/E for the S&P 500 Index is currently 26.9, a decline from last month’s 27.8 due to a flat November market and higher Q3 Y/Y reported earnings. Even so, this month’s reading remains higher than 89% of periods since 1984. Similar valuation levels have historically translated into headwinds for US stock returns.

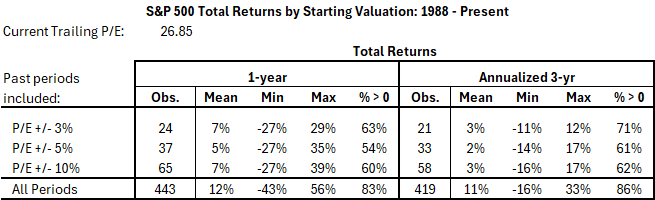
Historical periods with starting valuations similar to today include select months during 1998, 2000, 2003, 2021, and 2024. Analysis of total returns from these “best-match” periods shows the following:
- The index rose an average of 7% over the subsequent year but only an annualized average of 3% over the next three years. For comparison, since 1988 the index’s average total return over those time horizons has been 12% and 11% per year, respectively.
- The index fell over the next year in 37% of best-match periods and was lower after three years in up to 29% of periods. Notably, 40% of all negative 3-year outcomes observed since 1988 had a starting P/E within 10% of the current value, despite the relatively small number of best-match periods included in the analysis(~15%).
- None of the best-match periods saw exceptional returns (30%/yr or more) that the index has achieved with lower starting valuations. The highest 3-yr return was a constrained 17% per year.
- On the low side, one close comparable period (May 2000) saw annualized 3-yr returns of -11%. For reference, the worst 3-year period spanning the 2008 financial crisis was only -10%, from June 2007 – June 2010.
Note: These results depend on how closely we match today’s trailing P/E to past values. The following table shows analysis for periods with starting P/E within 3%, 5%, and 10% of today. The story appears consistent at all levels.
Disclaimer:
This report is 100% historical fact and does not constitute investment advice. None of the information should be interpreted as a recommendation to buy, hold, or sell any investment security.
As the saying goes, past performance is not a determinant of future returns. The next 1-3 years may or may not fall within historical ranges. Differences in index asset composition, monetary policy, inflation, and numerous other factors will all play a role in corporate results that drive index dividend returns and investor decisions that drive price returns.
Methodology Note:
To smooth historical spikes in P/E measures during economic downturns, Windfactor overlays an earnings recovery model based on the latest (then-reported) revenue figures and pre-downturn profitability rates. This allows for better matching of historical periods based on forward earnings potential without relying on noncomparable analyst estimates.
Sources:
S&P Global Indices, Yahoo Finance
