Valuation Headwinds for US Equities
Our forward P/E for the S&P 500 Total Return Index is currently 26.9, higher than 93% of periods since 1984. These valuation levels have historically translated into moderate-to-heavy (but perhaps not hurricane strength) headwinds for US stock returns.

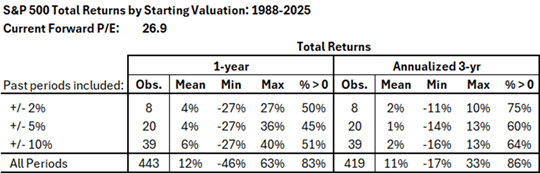
Historical periods with starting valuations similar to today include 1998, 2000, 2020, and 2021. Analysis of total returns from these “best-match” periods shows the following:
- The index rose an average of 4-6% over the subsequent year but only an annualized average of 1-2% over the next three years. For comparison, since 1988 the index’s average total return over those time horizons has been 12% and 11%/year respectively.
- The index fell over the next year in 45-50% of periods and was still lower after three years in 25-35% of periods. Notably, this accounts for a quarter of all negative outcomes observed since 1984 despite the relatively small number of best-match periods (<9%).
- None of the best-match periods saw exceptional returns (20-30%/yr or more) that the index has achieved with lower starting valuations. The highest 3-yr return was a constrained 13%/yr.
- On the low side, one close comparable returned -11% per year. Another with a slightly higher starting valuation saw 3-yr returns of -16% annualized. Outside of the 2008 financial crisis, no period with lower starting valuations has seen the index fall by so much over similar time frames.
These results depend on how closely we match our current forward P/E to past values. The following table shows results for periods with starting values within 2%, 5%, and 10% of today along with average returns for all periods for comparison.
DIsclaimer
This report is 100% historical fact and does not constitute investment advice. None of the information should be interpreted as a recommendation to buy, hold, or sell any investment security.
As the saying goes, past performance is not a determinant of future returns. The next 1-3 years may or may not fall within historical ranges. Differences in index asset composition, monetary policy, inflation, and numerous other factors will all play a role in corporate results that drive index dividend returns and investor decisions that drive price returns.

Leave a comment